Odysee monitoring and more data visualisation: the new dashboards are out
In February, we released the first version of the dashboards for the CrossOver project. This second version enhances the first one, and adds a new platform monitored: Odysee
As a reminder, the dashboards are visual tools allowing journalists to conduct for example OSINT investigations or journalistic investigations. As a first step, the project gathered data from Google search, Google news, Youtube search and suggest, Twitter, Facebook and Reddit.
The idea behind the creation of those dashboards was to understand how the recommendation algorithms could lead users users to be confronted to disinformation while they were navigating on those platforms.
For the second version of the dashboards, we decided not only to enhance the existing dashboards, but also to dig a bit deeper in the internet and include a new platform in our monitoring: the sulphurous Odysee.
Enhance data management and visualisation
The multidisciplinary CrossOver project gathers journalists, researchers, MIL stakeholders and tech providers. The exchange of good practices among the stakeholders enables the creation of a virtuous loop of knowledge sharing. The dashboards are the first gathering place for all those competencies. The analysis of data displayed in the dashboards already led to articles from Apache, papers explaining the methodology and the approach of the team, and a thread to question Twitter about the presence of the word “Nazis” in the Trends for Belgian users. More investigations will also be released.
Both researchers and journalists have included the dashboards in their analysis of social media content. Data is gathered in a coherent and standardized way, allowing for efficient research and identification of suspicious content.
The second version of these dashboards includes enhancements of data visualisation by offering comprehensive charts. For example, it allows to see the evolution over time of the recurrence of a Youtube channel among the most recommended ones after a search on a specific keyword. Another example is to see the evolution of the ranking of a keyword in Twitter trending topics. Data and keywords can also be compared in those charts. They empower journalists and researchers with a macro-vision of the evolution of trends.
Focusing on a more specific social media platform
The overall aim of the CrossOver project is detect, analyse, investigate and disclose disinformation campaigns in Belgium in French and Dutch, as well as improving societal resilience to disinformation. As the first version of the dashboard focussed on popular social media platform, the consortium decided to dig a bit deeper into the internet and to start monitoring the so-called « Youtube for far-right » : Odysee.
Dr Eviane Leidig explains that « Odysee is not inherently a platform for far-right or extremist content creators. For many, it primarily serves as a backup, or secondary, library. But for YouTubers that have been banned or demonetised, Odysee serves as an attractive option. Upon public release, the platform recorded 8.7 million users since beta testing began in September, thus delivering potential for a wide audience. Popular channels include a spectrum of far-right commentators ranging from right-wing academic Jordan Peterson, alt-right YouTuber Tarl Warwick, and MAGA pundit Elijah Schaffer who participated in the US Capitol insurrection and popularised the false narrative of the 2020 election result as illegitimate. »
In the scope of the CrossOver project, it is interesting to dig deeper in that kind of platform which might be a channel to spread disinformation as it has little or no regulation. It enables to see how content is linked together and which stakeholder decided to use Odysee as a medium to share their content.
Similarly than for Youtube, we collect data about recommended content after a user performs a search on Odysee.
As no official API is available on the platform, we collect data from programmatic public endpoints and display them on the newly released Odysee dashboard. Like on all other dashboards, everyone can see what videos are recommended after a user performs a search on a specific keyword, and select the date and time of data collection.
Discover more
What methods are used for data collection
As previously stated in the blogpost “What data is collected”, the idea is to put oneself in the shoes of a Belgian user, to collect data the same way Belgian users would see it.

Unresolved jihad targets Europe
The second repatriation of women and children of Islamic State (ISIS) to Belgium provokes a lot of criticism. There is a lack of understanding, mistrust and a fear of new attacks. The return is stirring up public opinion on social media, as shown by data retrieved by CrossOver.
CrossOver Expands Watch on Recommendation Algorithms
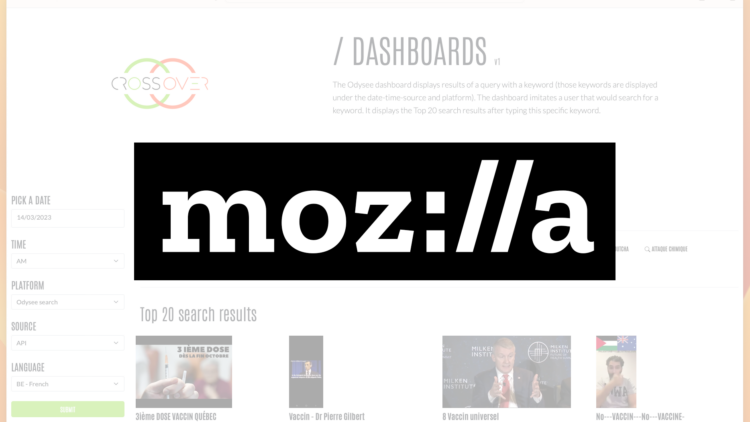
CrossOver has been selected by the Mozilla Technology Fund to continue running for a year in 8 more regions.

Unveiling the Hidden Layers of the Web: Introducing our Open-Sourced Scrapers
We’re thrilled to announce a new milestone in our journey towards data transparency and platform accountability. The scrapers we used in the CrossOver project to confront data with the information provided by platform’s official APIs are now open-sourced!