Methodology
Summary
The CrossOver project monitors content recommendation algorithms used on some of the largest social media and content platforms available to the population of Belgium. Data collection is the first step of the project. The collected data is then displayed in dashboards, a visual tool allowing journalists to conduct for example OSINT investigations and journalistic investigations.
Note: for clarity, the monitored platforms, such as Google, Facebook, Twitter etc are referred to in this document as service providers
Scope of the project
The Crossover project was created to monitor content recommendation algorithms on the major social media service providers. The project aims at measuring and analysing which types of content are recommended to users as they use these services to consume or to search for content. Crossover developed strategies to collect data about content recommendation through both the means offered to developers and researchers by the service providers (APIs) and by way of user simulation. The goal of the project is to accumulate detailed data using both techniques, permitting accurate qualitative and comparative analysis of the publications, photos, links, videos or other recommended by service providers.
Data collection strategies
For each of these service providers, CrossOver designed a strategy to collect and compare content recommendations (as described in detail here). The data is collected from two main sources:
- Official APIs (when available)
- User simulation, through use of a network of computers spread out across Belgium at volunteer homes.
The following table breaks down a summary of the differences between the two sources.
| Official API or programmatical public endpoints | User Emulation | |
| Description | Programatic tool designed by the platform to allow access to information otherwise available on their websites and apps. These tools are usually offered to developers but are also used by many researchers. | Computer simulation of a person accessing the platforms’ websites and interacting with the content (clicking, scrolling etc…) |
| Purpose of collection | Get the official representation of content recommendation as communicated by the service provider | Get multiple datasets by simulating browsing sessions as if they were performed by an actual human, from different locations |
| Mean of collection | Request to API, specifying Belgium as country if allowed by API, as well as language (fr, nl) or request to programmatical public endpoints with same parameters | Web scraping using a network of computers running specifically developed software, spread across Belgian residential addresses |
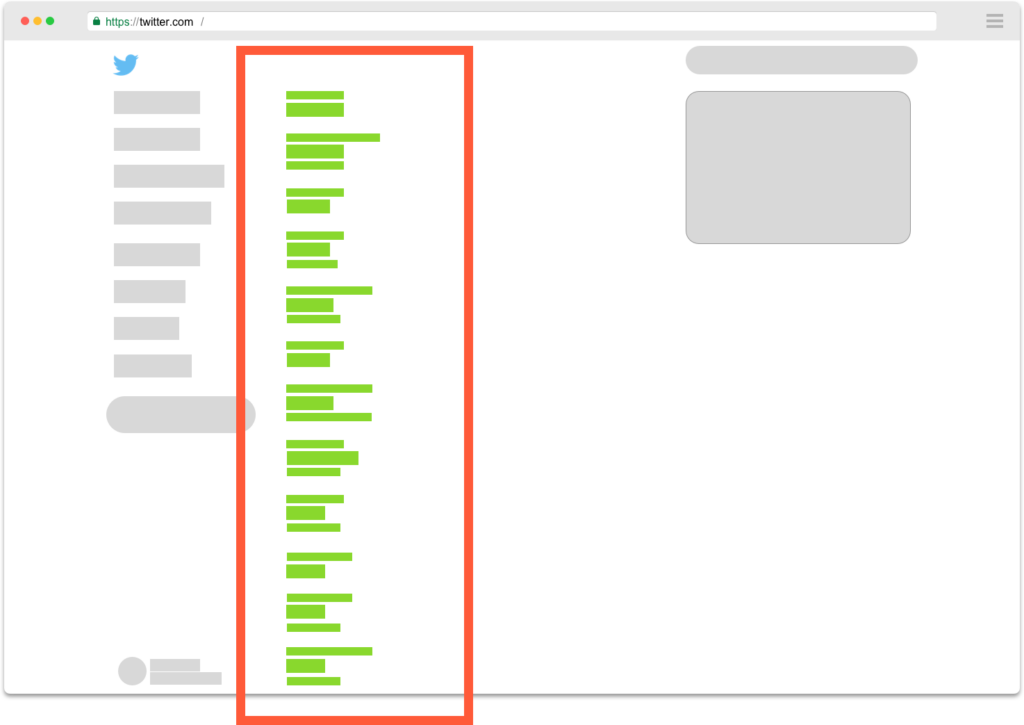
Data collection for content categorised as popular by the service providers (Twitter, Reddit, Mastodon)
The so called “trending topics” (Twitter) and “hot posts” (Reddit) displayed by these service providers are collected. No user interaction is required. Using both API requests and user simulation, CrossOver collects the data, stores it for each request in a structured data format, adding metadata such as IP address and other identifiers. The data format used for the user simulation matches or is as close as possible to the format provided by the API response to enable efficient and easy comparison at a later stage.
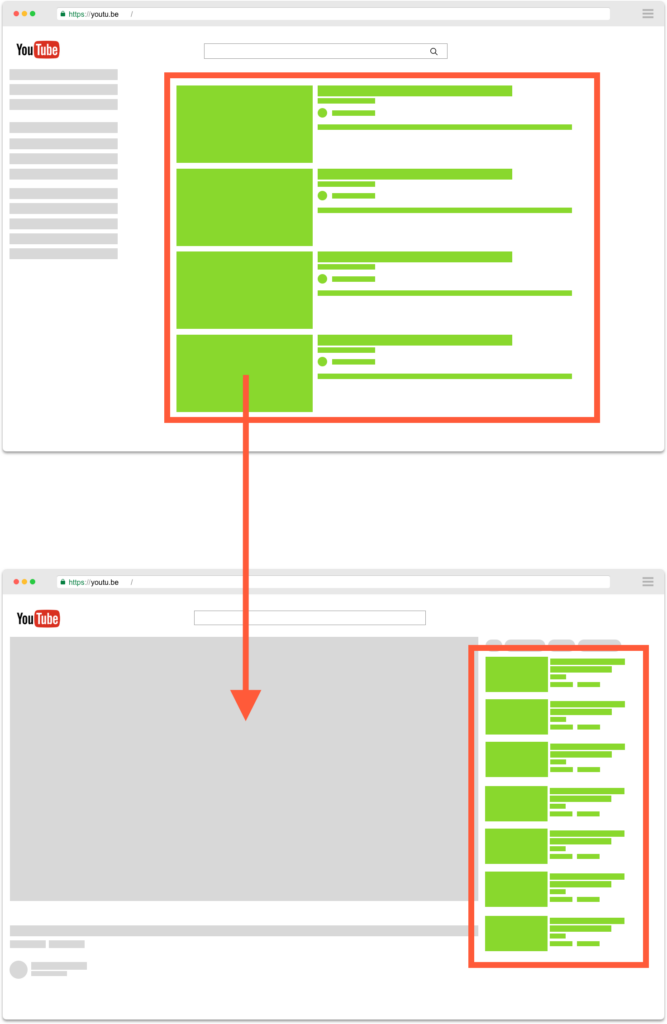
Data collection of content recommended after a user performs a search (Youtube, Google, Facebook, Odysee)
This type of data collection implies an action from a user. For example, if one wants to collect Google autocomplete suggestions, some text needs to be typed into the Google search bar before these suggestions can be shown.
CrossOver designed a set of different search terms to be looked up on these services. These words or expressions are supposed to be representative of search terms on sensitive topics, or topics appearing in the news cycle and proving popular and thereby subject to potential disinformation.
The decision was made by the CrossOver editorial committee to keep 75% of this list of queries the same throughout the duration of the CrossOver project to allow for a consistent dataset in time. Regular and coherent searches of these same terms will allow further data analysis, such as an evolution in time of the type of recommendations or search results for example. The remaining 25% of the list of queries can change, according to the specific needs or interests to follow a new topic and/or abandon data collection on a topic that fell in popularity or interest for research.
To constitute these datasets, calls are made to the service provider’s official APIs and other to programmatical public endpoints. Comparable datasets are obtained through user simulation. Results are then collected and stored in a comparable structured format.
Dashboards
For each of the monitored operator, interactive dashboards were created and rendered available to the CrossOver partners; they are public since the end of February 2022.
These dashboards allow for easy browsing and analysis of the collected data. The website reads the datasets stored in CrossOver’s database and represent them in a user friendly way.
For example the Youtube Search dashboard can show which channels were the most recommended for a given search term on Youtube. A selector allows the user to pick which dataset is to be displayed, from which source (API or user simulation), at which date, etc.
As the collected data is well structured, any sort of data visualisation is imaginable in subsequent versions of the dashboard.
The second version of the dashboard includes enhancement of data visualisation by creating charts that provide a comprehensive view of a situation. For example, it allows to see the evolution over time of the recurrence of a Youtube channel among the most recommended according to a search on a specific keyword or the evolution of the ranking of a keyword in Twitter trending topics. Datas and keywords can also be compared in those charts. It empowers journalists and researchers with a macro-vision of the evolution of tendencies.
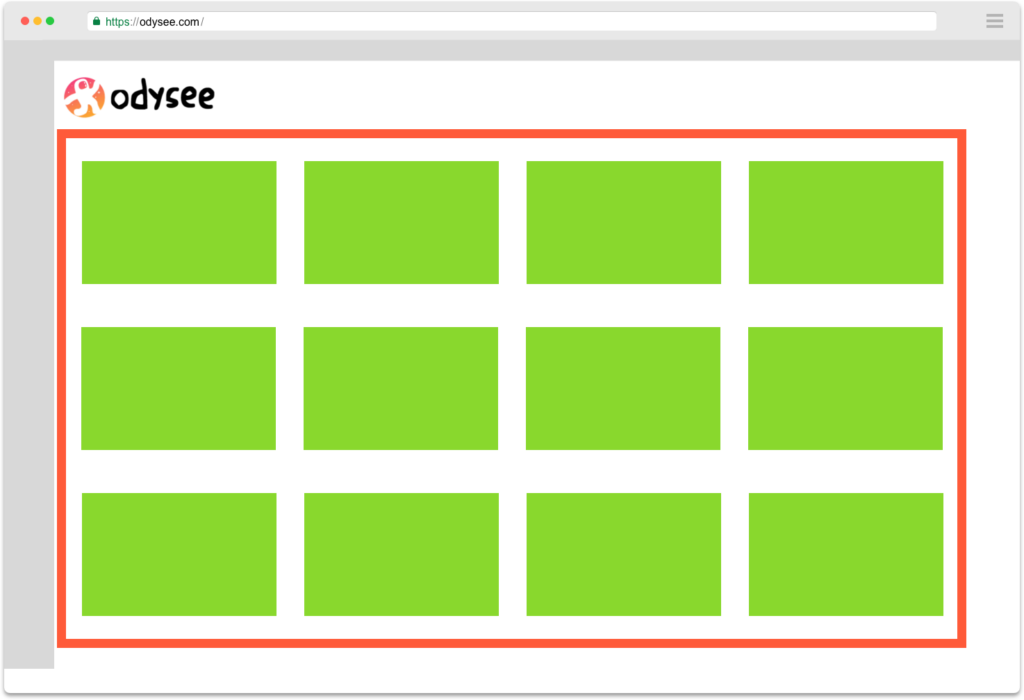
The new version of the dashboards also includes the monitoring of another platform: Odysee. Odysee is a video-sharing platform with little or no content regulation. The same way we proceed on Youtube, we collect data of content recommended after a user performs a search on Odysee.
As no official API is available on the platform, we collect data from programmatical public endpoints and display them on the newly released Odysee dashboard. As for each dashboard, everyone can see what videos are recommended after a user performs a search on a specific keyword, and select the date and time of data collection.
The following services are currently monitored :
Facebook “top interaction” posts in public groups and pages with the most interactions over the last 60min
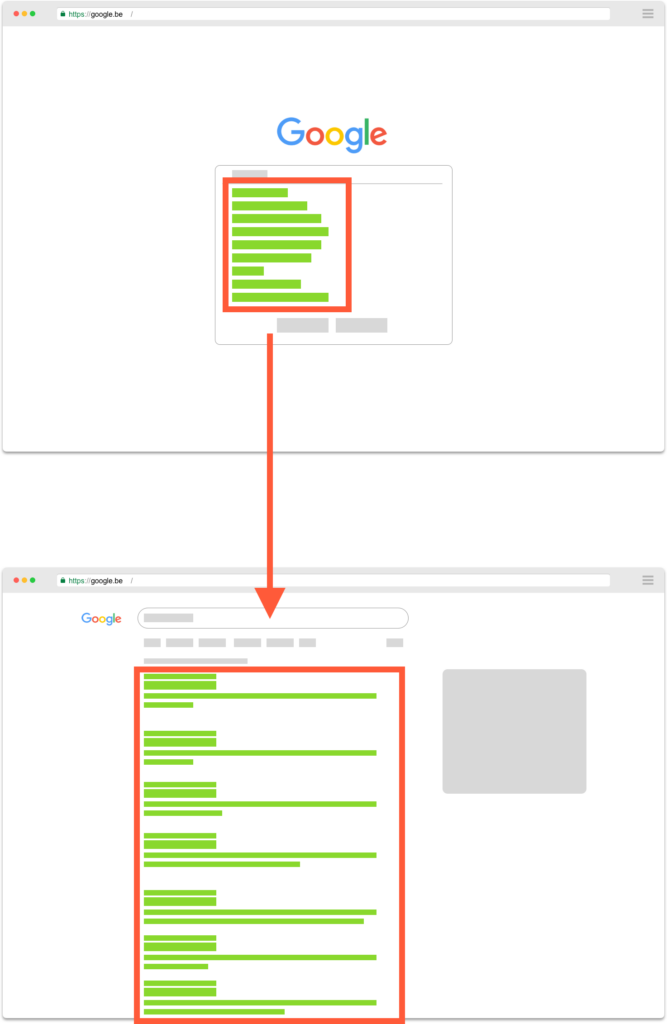
Google Search autocomplete suggestions and search results
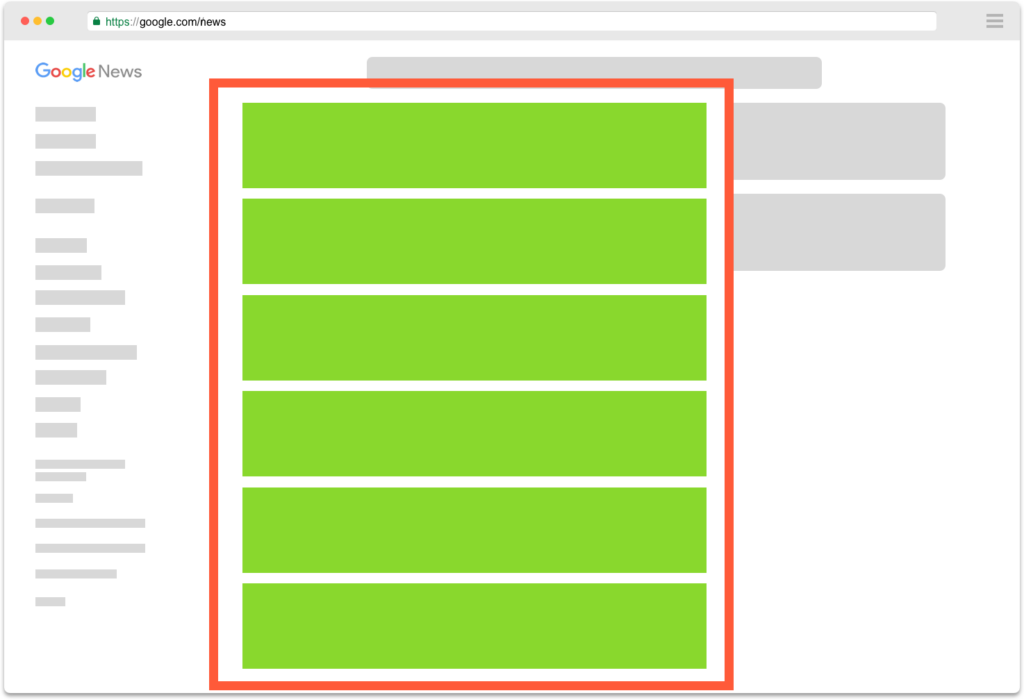
Google News top 100 results by keyword
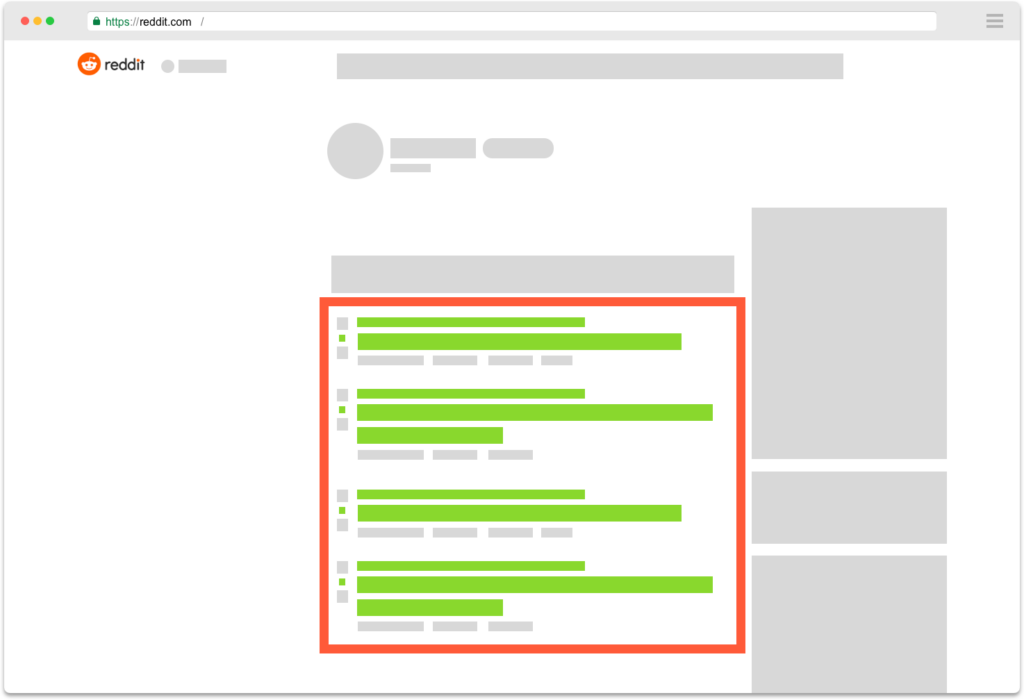
Hot posts in a selection of sub-reddits
Twitter trending topics
Youtube
Youtube search by keyword
Youtube related videos for each video returned by a search for a keyword
Odysee
Odysee search by keyword
Mastodon
Mastodon Trends