What data is collected in the dashboards ?
After 2 years of pandemic – and associated infodemic that spread out virulently, a lot of people have been confronted with dubious content on the internet.
Dubious information can simply come from a friend who shows you a video that he watched the night before. When you ask how he found it, he may answer simply: “I got lost on YouTube“
You may also encounter dubious content when you type in a keyword in a search bar and you see what the word is associated with the most popular queries on Google – a topic that fascinates a lot of people.
It can be a Twitter trend which is no longer trendy anymore when you finally understand what it was about.
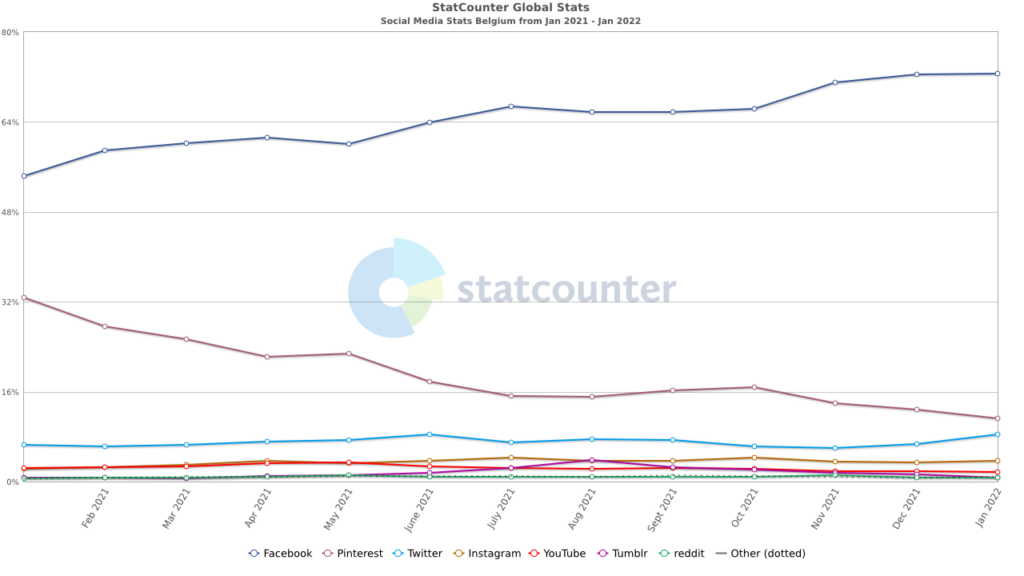
Nowadays, a lot of people have been exposed to disinformation in the world. Social networks have been singled out for their role in the spreading of mis/disinformation as they play a key role in the way people get their news.
Platforms have been criticized for their lack of transparency, especially in their content recommendation algorithms. They have made progress towards accountability by creating transparency centers, collaborating with researchers, giving access to data, etc.
At CrossOver, we decided to put ourselves in the average user’s shoes and wondered: how did your friend -who doesn’t seem to believe everything he sees- got “lost” on YouTube? What path did he go down? What role does the algorithm play in that kind of case?
To answer these questions, the starting point of the project was to put oneself in the shoes of a Belgian user. Understanding that gives the scope of the project, which can be summarized in 3 words: cross-border, cross-language and cross-platform.
Cross-border
The data collected are extracted from service providers active in Belgium, simulating a Belgian user navigating on social media platforms. But as the national borders are blurred when it comes to content available on those platforms, the project might allow us to see how narratives can circulate in other countries. French disinformation investigations often span France, Canada, Switzerland, and Belgium. Flanders can be affected by Dutch narratives in the same way, and thus by disinformation coming from The Netherlands. At the crossroads of Flanders and Wallonia, with “180 nationalities, 100 languages spoken and two out of three residents born abroad, Brussels is the second most cosmopolitan city in the world” . It seemed necessary to take into account both languages of Belgium to see how narratives can circulate throughout the whole country, and how its population can be influenced.
Cross-language
The collection of data is made in both Dutch and French, two of the official languages of Belgium. This 2-faceted approach enables us to analyse, compare and understand the spread of content in two specific and closely related linguistic communities. It also gives the project a cross (linguistic) border approach.
Cross-platform
CrossOver focuses its collection of data on several online platforms:Facebook, Google, YouTube, Twitter and Reddit.
GDPR: For the purpose of our CrossOver dashboard project, we gather the following data: Reddit user names, YouTube channel names. These data are processed by Check First, and hosted on the servers of a third party, OVH France.
All these social media platforms have a high number of users in Europe and in Belgium.
To put ourselves in the shoes of a Belgian user, we decided to split the data collection according to the way people use social media: either they are exposed to content when they are scrolling through their phone, or they search for a specific piece of content on a platform.
Content filtered by research
You don’t know something? Google it!” : people have the tendency to look for answers to their questions on search engines. Search engines have algorithms and display the results of a search in a specific way. The CrossOver project focuses on Google and YouTube: “With an average of 1.4 billion monthly searches, “YouTube” was the most popular online search query in 2021. Social media giant Facebook was the next most searched query on Google in 2021. The most popular question asked on Google search was “what to watch” according to Statista.
Google search and Google news
Google is the most popular search engine on desktops in Belgium. Users can’t scroll through a Google page if they are not looking for a specific keyword or expression: they have to do a request. Accordingly, two types of data were collected: Google Search’s autocomplete suggestions as user types a search term in the search bar on google.be and Google News top 100 results by keyword: Google News service, available when clicking on the News tab on google.be. Data collection runs twice a day.
This collection allows one to see what content in general is displayed to a user interested in a specific topic, but also what he can read when he looks for the “News” section. It can be assumed that the user is looking for journalistic content, or an article about a specific topic. However, it is important to underline that Google selects articles according to “The popularity, quality, and relevance of the content; [the user] prior interactions and purchases with Google News and other Google services. Some publishers could have a contractual agreement with Google to allow licensed use of their article content; this doesn’t affect article ranking. [a user] having a subscription to a paid content provider does raise that publisher’s content ranking.”
Youtube
YouTube is Belgium’s second most visited website, right after its parent company, Google. Now a user can actually scroll through the content that is recommended on the landing page, but the searching aspect remains pretty important when it comes to the video platform.
Two types of data are collected for YouTube:
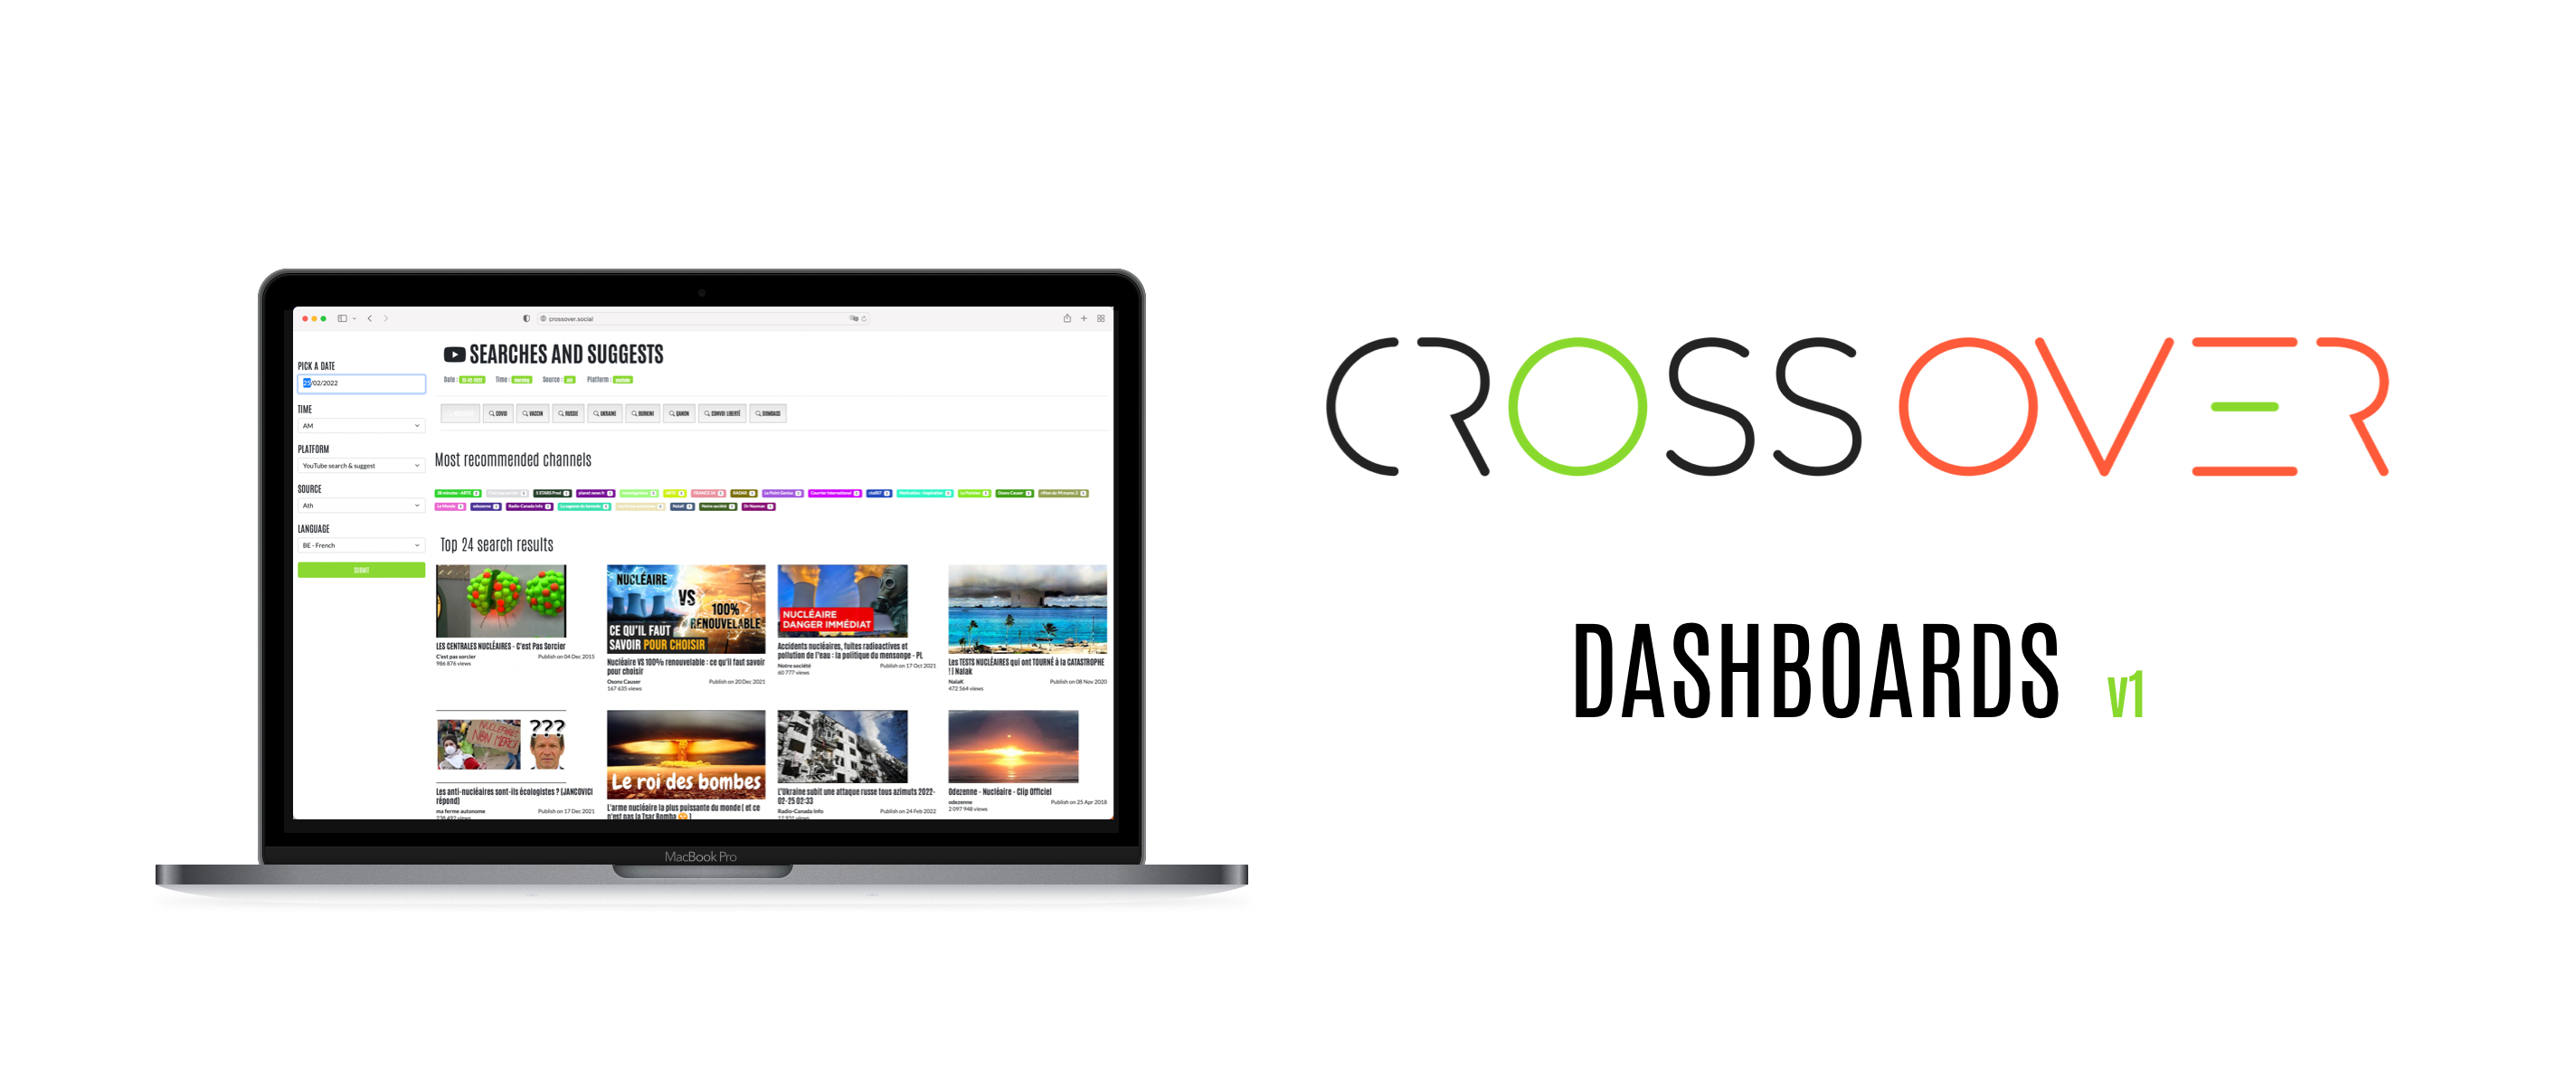
The first one concerns YouTube search by keywords, and collects the results presented by YouTube for a given search expression.
The second one derives from the first one and consists in collecting the data from the YouTube related videos for each video returned by a search for a keyword, twice a day.
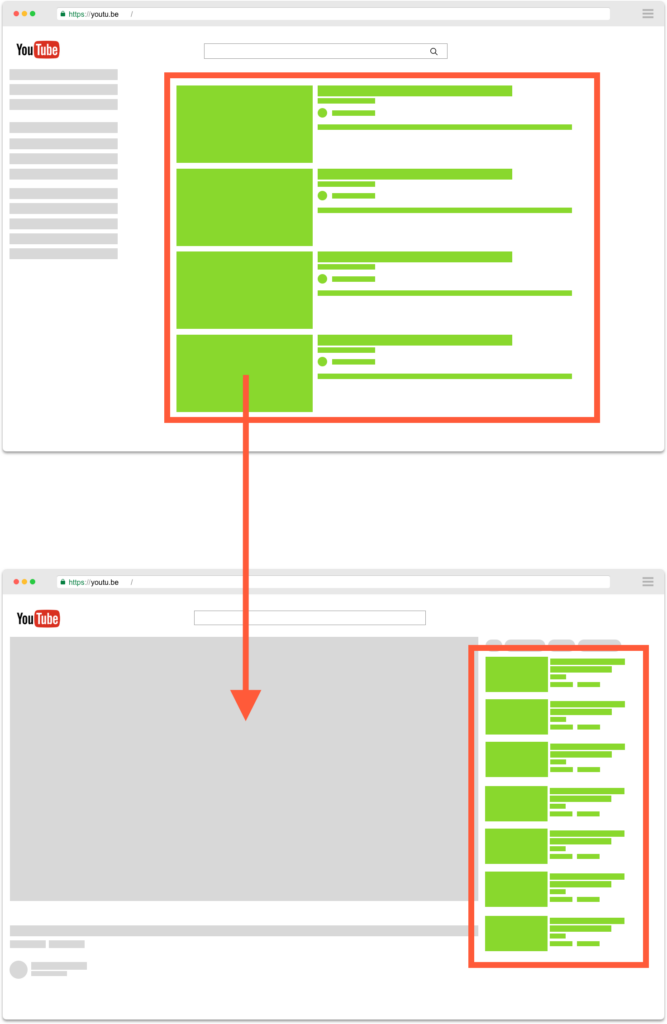
The idea behind this is to see what the user will be confronted with if he leaves the automatic “up next” mode-on, and how he can get “lost” on YouTube, or be confronted with content that has nothing to do with what he was looking for.
Content displayed directly to the user
The other data collection process focuses on platforms on which a user scrolls through. Facebook, Twitter and Reddit are neither search engines, nor platforms where people’s first intention is to look for a specific term -although one can be looking for a specific person (Facebook), topic of discussion (Reddit) or tendency (Twitter). This explains why we decided to collect other types of data on those platforms.
On Facebook, the focus is made on “top interaction” posts in public groups and pages. The posts displayed in the dashboards are the ones with the most interactions over the last hours. It gives an idea of what content can be seen by any Facebook user that is interested in a specific topic, as it doesn’t require this user to be part of a private group or friends with anyone. The content is public and even available for those who don’t have a Facebook account.
Twitter greatly invites the user to follow the trends people are talking about: once a user is on the platform, he can see “Trending: Belgium” at the right of his screen, but also a little Hashtag “#Explore” on the left. The platform specifies that “Trends are determined by an algorithm and, by default, are tailored for you based on who you follow, your interests, and your location…This algorithm identifies topics that are popular now, rather than topics that have been popular for a while or on a daily basis, to help you discover the hottest emerging topics of discussion on Twitter.” These statements motivated us to monitor the trending topics every hour. But as our monitoring is not personalized as a human user with an already existing Twitter account (at least not yet, see blogpost 2 “How do we collect data”), we decided to focus on the part where the platform announces that the user can “choose to see Trends that are not tailored for you by selecting a specific Trends location on twitter.com, iOS, or Android. Location Trends identify popular topics among people in a specific geographic location.” Thus, the data collected for the CrossOver project are topics or hashtags presented by Twitter as most active for a given geographical scope, that is to say kept only if “Trending in Belgium”).
Reddit also adopts this recommendation-oriented approach, as the first thing displayed on top of the landing page is “Trending today”. The content takes the form of forums -known as subreddits – on specific topics that people can discuss. The data which is collected twice a day is the so-called hot posts, that is to say Topics displayed by Reddit as the most popular in a selection of subreddits.
Now that the scope of what data is collected on which platform is determined, our next focus will be made on the methods used for data collection.
Discover more

Events: CrossOver at the heart of this weekend’s debates
CrossOver will be part of two discussions this week-end in Toulouse and Antwerp!
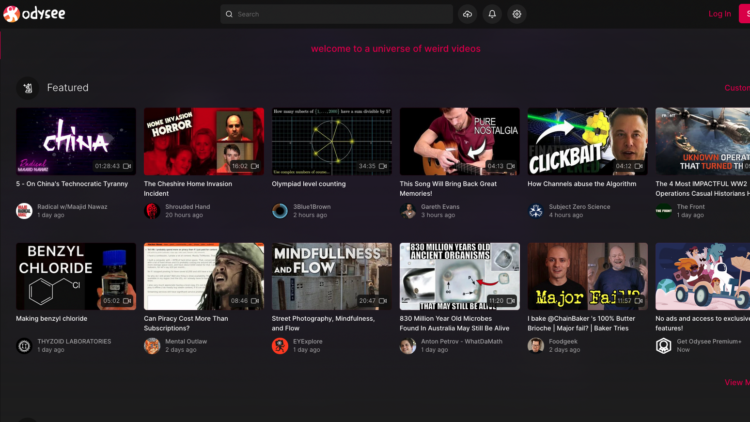
Odysee monitoring and more data visualisation: the new dashboards are out
In February, we released the first version of the dashboards for the CrossOver project. This second version enhances the first one, and adds a new platform monitored: Odysee

Upcoming events: where to hear from CrossOver in fall 2022
CrossOver will be presented at several webinars, conferences or discussions. Want to hear more about the project? It’s here.

See what algorithms recommend to Finns on Tiktok, YouTube and other platforms: CrossOver Finland dashboards are now live
Check First and the Finnish fact-checking organisation Faktabaari have developed a methodology that allows anyone to look under the hood of social media recommendation algorithms.