What methods are used for data collection
As previously stated in the blogpost “What data is collected”, the idea is to put oneself in the shoes of a Belgian user, to collect data the same way Belgian users would see it.
Users can be exposed to content in two main fashions: either by scrolling social media platforms feeds (Facebook, Reddit, Twitter) or if by searching for a specific term or expression in a search bar to see related content (Google, Youtube).
Before starting to collect the data, one question remained: what do people look for on the internet that might lead them to disinformation? Echoing the infamous question “how do people get lost on Youtube?”
We designed a set of keywords that is meant to reflect what people are looking for on the internet. The idea is to remain as neutral as possible to see how a user can be attracted to disinformation, for example by looking up the term “vaccine” or “covid”. It was also considered that some topics are intensively occupying the public debate, but for a short period of time (days or weeks). To take all those dimensions into account, the list of keywords is composed of 75% of static keywords meant to be monitored throughout the duration of the CrossOver project. This terms reflect central topics in the public debate; the remaining 25% are dynamic, timely keywords that change depending on the interest as it rises among the public.
Once the list of keywords is determined, the scope of the needed data is narrowed. It is time to decide on a method to collect them.
The most obvious way to collect data from social media platforms is to use their APIs.
What is an API and why is it relevant to use one ?
The MIT has a complete answer to that question: « An API, short for application programming interface, is a tool used to share content and data between software applications. APIs are used in a variety of contexts, but some examples include […] dynamically posting content from one application to display in another application, or extracting data from a database in a more programmatic way than a regular user interface might allow. »
This is partly what we do: extracting the data, storing it and displaying it in another way, in this case the dashboards you can find on https://dashboard.crossover.social/
The MIT also adds that « Many scholarly publishers, databases, and products offer APIs to allow users with programming skills to more powerfully extract data to serve a variety of research purposes. »
Based on the platforms’ APIs, we collected several datasets to display them in dashboards (see blogpost 3).
Data collection based on the API
Content filtered by search
Google search
Google does not provide an API to collect autocomplete suggestions or search results.
Google News
Data is collected by retrieving an RSS feed, the one that is displayed when a user types a specific keyword in the search bar. It allows for regular updates and follows the evolution of a theme in the « news » content by Google.
Youtube
The Youtube Data API is used to retrieve search results for a given keyword. This API is meant to be used by developers to allow Youtube functionality in their products. It is also the de facto tool used by researchers to analyse the service.
Content displayed directly to the user
Twitter trending topics are collected by polling the official Twitter API, specifying the geographical scope of Belgium.
Note: despite a request to Twitter, Inc for a wider access to their API, the CrossOver project was declined such access.
Reddit provides a complete API to access its data. CrossOver uses the endpoint allowing access to a specific hot topic of a subreddit.
CrossOver uses the CrowdTangle API to retrieve data. This is a common way researchers are granted access to Facebook’s data and is representative as the typical way Facebook officially shares data with researchers.
But we didn’t stop there. An API doesn’t reflect which content a particular user is exposed to. An API provides information from machine to machine with no personalised user interaction in mind.
We wanted to go further, in order to be the most precise and honest in our analysis. As such, we decided to simulate user interaction on social media platforms.
Data collection through user simulation
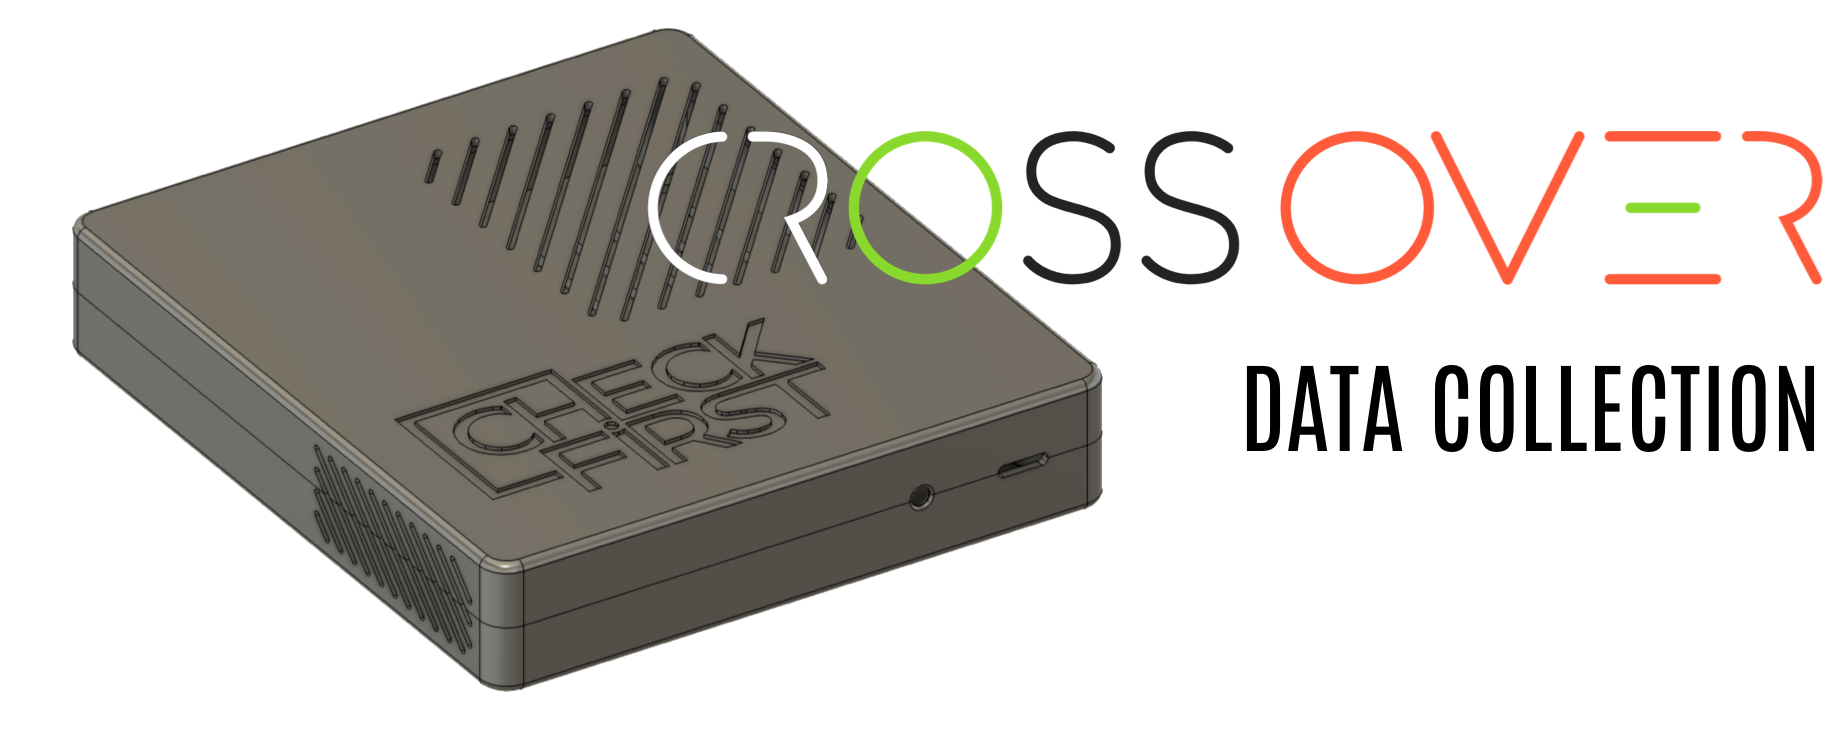
We didn’t hire people to scroll through their phone or browse Twitter all day long, but we developed a software stack that simulates human behavior on platforms, running on a set of credit-card sized computers : Raspberry Pi.
As a reminder, the idea is to simulate Belgian users, but they could live in any province in Belgium. In order to narrow the scope of our dataset — and see what province might be influenced by which type of content – we decided to locate monitoring devices in each Belgian province.

The monitoring is running automatically – there is no need for human interaction – and allows for comparison between the API and the datasets sent by the monitoring devices..
Content filtered by search
For the content where we simulate a user looking for something on the web, we use the above-mentioned keywords to launch queries and monitor the results.
Google search
For each autocomplete suggestion, a Google search is performed from a simulated browser session, retrieving the 10 first results.
Google News
not yet implemented
Youtube
A python script accesses the url https://www.youtube.com/results?search_query= specifying a search keyword from the predetermined search keywords list.
The first 24 results are stored, including video metadata for each result.
Then, a new browser tab is opened for each of the 24 results and metadata about the 20 first related videos is collected.
Content displayed directly to the user
A python script simulating a non-logged in user collects data from the webpage https://twitter.com/i/trends and retrieves the available trends, if the word Belgium (in French, Dutch and English) is present in the trend category.
A python script queries the webpage https://reddit.com/r/belgium and https://reddit.com/r/antwerpen and collects the available hot topics.
No user simulation here as there is no known way to access the entire Facebook post database through user simulation to collect comparable data obtained from the CrowdTangle API.
Why simulate a user while we could have worked directly with APIs ? The answer will be in our next publication, which will also explain everything about how the data is displayed in the dashboards and how it can be used.


